Every single day, humans and machines generate millions of terabytes of data. Every click, purchase, swipe, and sensor reading adds to an ever-expanding digital universe. However, raw data on its own is practically useless. It is just a chaotic jumble of numbers and text until it is processed, structured, and analyzed. That is exactly where the different Types of Data Analytics come into play. Data analytics is the science of analyzing raw data to make conclusions about that information. For modern businesses, it is the difference between operating in the dark and navigating with a GPS. But not all analytics are created equal. Depending on what you are trying to achieve, you will need to apply different methodologies.
Whether you are a business leader trying to optimize your supply chain, or a professional looking to upskill with a specialized data analytics course, understanding the four primary stages of data analytics is crucial. Here is a comprehensive breakdown of the four key types of data analytics, how they build upon one another, and why they matter to the future of business.
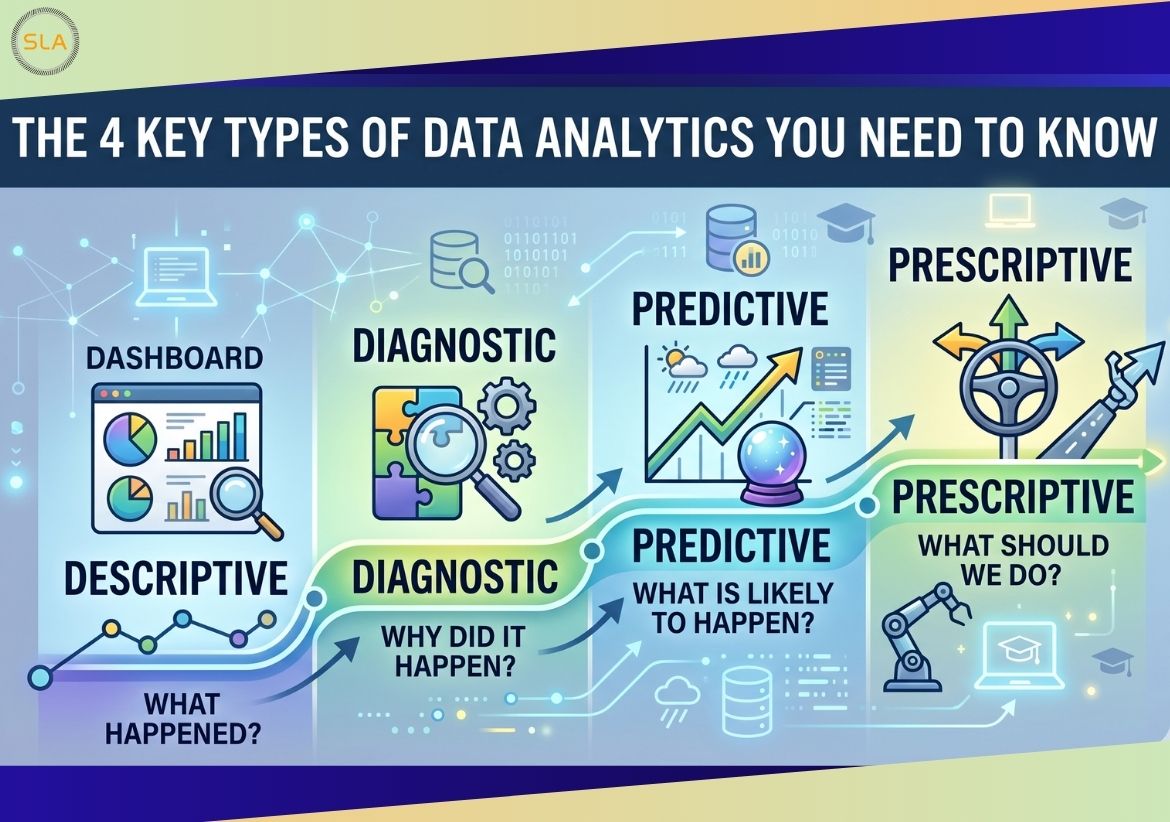
1. Descriptive Analytics: What Happened?
Descriptive analytics is the foundation of all data insight. It is the most basic and most commonly used form of analytics. Simply put, it looks at historical data to answer one specific question: What happened?
This type of analytics takes historical data and summarizes it into something readable and understandable. It does not try to establish cause and effect, nor does it try to predict the future. It simply presents the facts as they are.
- How it works: Descriptive analytics relies heavily on standard reporting, data aggregation, and data mining.
- Real-world examples: Monthly revenue reports, website traffic dashboards, inventory stock levels, and quarterly sales figures.
- Business Value: This is the starting point. Without descriptive analytics, a company has no baseline. For instance, an e-commerce store needs descriptive analytics to know that they sold 10,000 pairs of shoes last month, which was a 15% increase from the previous month.
Key Takeaway: Descriptive analytics gives you the “hindsight” necessary to understand your current standing.
2. Diagnostic Analytics: Why Did It Happen?
Once you know what happened, the natural next question is why. Diagnostic analytics takes the insights found in descriptive analytics and digs deeper to find the root cause of a specific outcome.
If your descriptive analytics dashboard shows a sudden 20% drop in website traffic, diagnostic analytics is the detective work required to figure out the reason behind the drop.
- How it works: This phase involves techniques like drill-down, data discovery, data mining, and correlations. Analysts will isolate patterns and investigate anomalies.
- Real-world examples: Investigating a sudden spike in customer churn, finding out why a specific marketing campaign failed in a particular region, or determining why a manufacturing machine keeps breaking down.
- Business Value: Diagnostic analytics prevents businesses from guessing. Returning to our e-commerce example, if sales dropped, diagnostic analytics might reveal that a recent software update caused the checkout page to crash on mobile devices.
By understanding the “why,” businesses can fix underlying issues rather than just treating the symptoms.
3. Predictive Analytics: What Is Likely to Happen?
This is where data analytics transitions from looking at the past to looking at the future. Predictive analytics uses historical data, statistical algorithms, and machine learning techniques to identify the likelihood of future outcomes.
It asks the question: What is likely to happen next?
While predictive analytics cannot tell you exactly what will happen with 100% certainty, it can forecast probabilities with a high degree of accuracy. Because of the complex algorithms and modeling required at this stage, professionals often need formal data science training to build and refine these predictive engines.
- How it works: This involves machine learning, forecasting, pattern matching, and predictive modeling. It requires clean, well-structured data to train the models accurately.
- Real-world examples: Credit scoring (predicting if someone will default on a loan), weather forecasting, predicting next quarter’s sales demand, or identifying which customers are most likely to cancel their subscriptions next month.
- Business Value: Predictive analytics provides “foresight.” For our e-commerce store, predictive models could forecast that a specific brand of winter coats will sell out by mid-November based on historical weather patterns and current search trends, allowing the business to order more inventory in advance.
4. Prescriptive Analytics: What Should We Do?
Prescriptive analytics is the frontier of data analysis. It is the most complex, but also the most valuable. It not only predicts what will happen but also recommends the best course of action to take in order to take advantage of that future prediction.
It answers the ultimate question: What should we do about it?
Implementing prescriptive analytics requires highly advanced technology, including artificial intelligence, neural networks, and massive computing power. Because it relies on ingesting massive amounts of real-time data from various sources, building the infrastructure for prescriptive analytics is incredibly demanding. This is why professionals who have completed a rigorous data engineering course are in such high demand—they build the robust data pipelines that make prescriptive analytics possible.
- How it works: It uses complex algorithms, machine learning, simulation, and optimization to test various scenarios and suggest the optimal path forward.
- Real-world examples: GPS navigation apps (predicting traffic and prescribing the fastest route), algorithmic trading in finance (automatically buying or selling stocks based on real-time market shifts), and dynamic pricing models (like airlines or ride-sharing apps changing prices based on real-time demand).
- Business Value: Prescriptive analytics automates decision-making. If the e-commerce store’s predictive model notes a coming spike in demand for winter coats, the prescriptive model might automatically trigger a purchase order to the supplier and dynamically adjust the retail price on the website to maximize profit margins.
Navigating the Analytics Maturity Curve
It is important to understand that these four types of Data Analytics represent a maturity curve. You cannot successfully implement prescriptive analytics if you do not have a solid grasp of your descriptive analytics.
- Hindsight: Descriptive and Diagnostic (Past-focused, highly manual).
- Foresight & Optimization: Predictive and Prescriptive (Future-focused, highly automated).
Most companies begin their journey focusing heavily on descriptive and diagnostic reporting. As their data infrastructure matures and they hire more specialized talent, they begin to move into the predictive and prescriptive spaces.
Final Thoughts
Data is the lifeblood of the modern economy, but its true power lies in how we interpret and act upon it. By mastering the four types of data analytics—Descriptive, Diagnostic, Predictive, and Prescriptive—businesses can evolve from merely reacting to the past, to actively shaping their future. Whether you are looking to implement these strategies in your own organization, or you are looking to build a lucrative career in the tech industry, understanding this framework is the ultimate first step.
No Comments